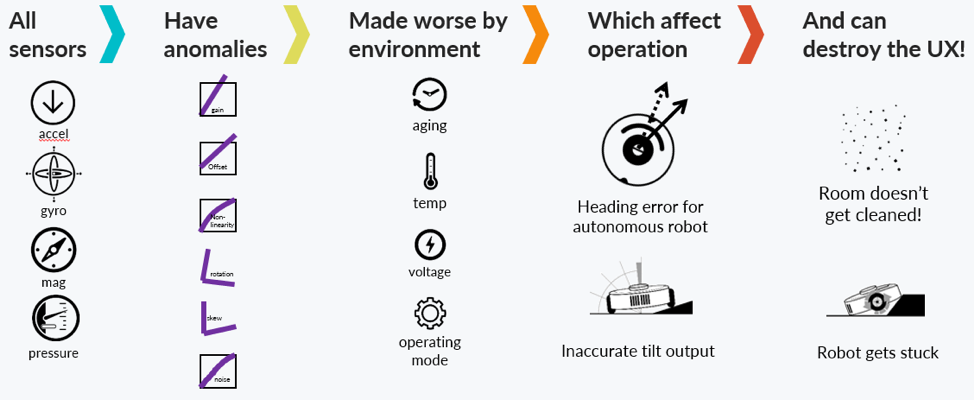
In an ideal world, sensors work perfectly, measuring output exactly as it is in the real world. But in real life, all sensors have anomalies that affect their measurements. Our SQTS (Sensor Qualification Test System) allows us to test the most common anomalies in sensors.
Monday, March 18, 2019
If you’ve been following along with our previous blog posts, you know that we pride ourselves on our deep understanding of sensors, and often mention our SQTS (Sensor Qualification Test System). Today, we want to take you behind the scenes to give you a sense of what we know.
Looking at Sensor Anomalies

In an ideal world, sensors work perfectly, measuring output exactly as it is in the real world. But in real life, all sensors have anomalies that affect their measurements. We detailed these anomalies in an earlier blog post, but for ease of reading, we summarized the definitions here:
Anomalies:
- Gain: sensitivity that measures how much movement affects the device output
- Offset: the shift in output independent of motion
- Non-linearity: any change in gain dependent on the speed of motion
-
Cross-axis: output not in the direction of motion. Cross-axis effects can be further decomposed into two parameters, rotation and skew:
- Rotation: the orthogonal rotation between input and output motion axes
- Skew: any cross-axis output that isn’t attributable to orthogonal rotation
- Noise: output that cannot be explained by any of effects mentioned above
When correcting for these kinds of inconsistent statistical outputs, it’s crucial to also measure and account for environmental factors as well:
Environmental Factors:
- Aging: changes in sensor parameters over time that cannot be explained by any of the other conditions that we just looked at.
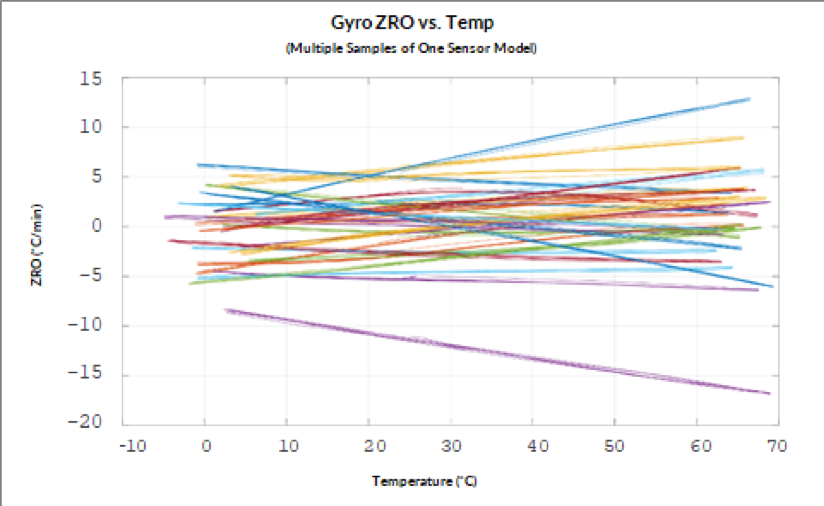
- Temperature: changes in sensor parameters from temperature. Though they are typically linear, they are occasionally non-linear and can have hysteresis, where the value depends not just on current temperature, but also on temperature history.
- Voltage: changes in sensor parameters as a result of changes in voltage applied to the sensor, within its operating range.
- Operating mode: changes in sensor parameters, caused by differing operational modes – like low power or performance mode, for example.
Eventually, these types of external environmental factors will worsen the universal sensor anomalies, resulting in shorter sensor lifespans and reduced performance. If not corrected, this can lead to negative customer experiences.
The Anomalies Can Be Minimized
With deep sensor analytics over years of study, we’ve been able to successfully account for these errors. Our SQTS logs data from a set of 210 sensors through varying conditions and positional permutations to determine the performance of each sensor. By moving the sensors through positional permutations, we can determine the anomalies discussed above, and by doing this while carefully varying the external conditions mentioned above, our system compiles a full set of information from the permutations.
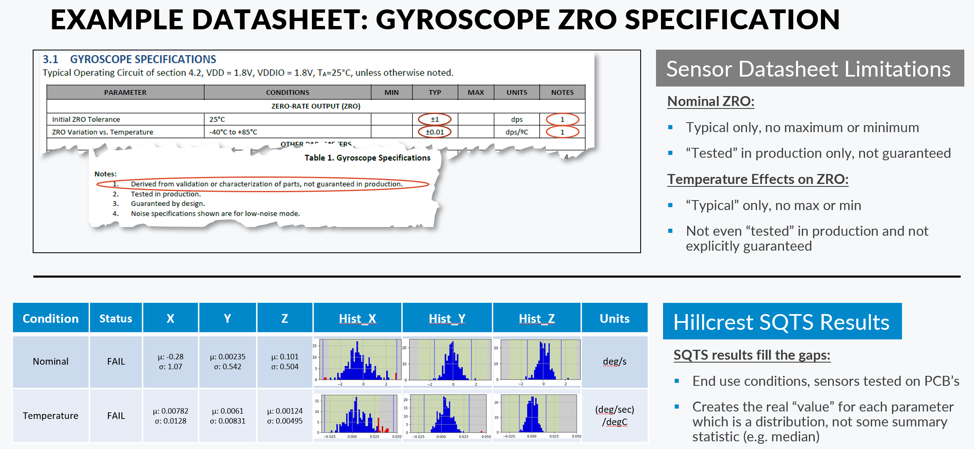
This statistically-significant spread of information is at the core of our sensor technology. Typical sensor datasheets don’t give enough information on the capabilities of the sensors, leaving critical details out.

For example, some datasheets don’t show max or min values of the ZRO (zero rate offset) and do not guarantee the results in production. However, through our testing with SQTS, we are able to determine and fully characterize ZRO, as shown above.
Sensor Analytics Delivers Better Sensor Fusion
But determining a more accurate viewpoint of the sensor is just the beginning. From there, we use that information to create a Monte Carlo simulation of the sensors we tested to develop a model that can simulate sensor fusion performance. This lets us tweak our sensor fusion algorithms to be as accurate as possible through motion.
We use that same information to determine which parameters are best suited for factory calibration and which are better suited for dynamic calibration. For example, dynamic calibration accounts for accelerometer and gyroscope bias over temperature and aging effects. Accelerometer bias results in tilt error, which leads to heading error. By logging a temperature profile and simulating sensor performance, we can verify accuracy. The same type of logic applies to gyroscope bias, and is corrected for similarly.

Moving from Simulations to the Real World
So you have a lot of good simulated data, but how do you know this applies in real life? In addition to our comprehensive data collection from SQTS, we have internal analysis tools to verify the accuracy at both calibration and full system testing levels. We use a third-party reference system to look at the absolute orientation of our consumer-grade devices and compare against the data sets to evaluate our accuracy.
Here’s an example of such a comparison:

In the image above, you can see the plot of angular position error between another supplier’s sensor and the reference system. It’s broken down into heading and non-heading error, with a histogram of the errors on the right. These real-world tests allow us to break down which part of the algorithm we want to focus on and change, while also producing data sets to run against.
As you can see, sensors are extremely powerful devices when their common anomalies are accounted for. However, it takes years of experience in real-world applications to not only identify the challenges, but also to develop solutions. Results like the one above are the reason that companies like Samsung and LG trust our experience and sensor fusion capabilities to help them improve their product performance.
If you want to learn more about how to improve the performance of the sensors in your application, please reach out. We’re happy to assess your sensor integration and determine whether there are opportunities to improve the performance and quality of the implementation.

