The key to choosing the best IMU for your project is a full understanding of what is possible with the technology.
Tuesday, December 18, 2018
So, you’ve decided your next project needs some motion sensing technology. But how do you choose one? There are so many qualities to consider before you make your decision. Where do you even start?
Well, we suggest you start here, with this glossary of sensor terminology. Over 15-plus years, we have developed sensors and sensor fusion software and know intimately that the key to choosing the best IMU (inertial measurement unit) for your project is a full understanding of what is possible with the technology. And so, the first step in understanding is to define the terms.
GLOSSARY OF SENSOR TERMINOLOGY
Warning: This is a long list. You will want to bookmark this, or print it and stick it to your desk for later reference. This post guides you through the decision-making process, starting with sensor requirements to start you thinking about the basics. We then follow up with things to consider when using fused data, and finish with some descriptions for calibration options. (Note: you can find more information about the specific sensors referenced in this post, as well as more information about applications of sensor technology in general, by exploring the rest of our blog.)
Sensor Requirements
Digital Resolution: This describes the overall sensing capability of your sensor, and is based on two parts:
Range: The size of motion that the sensors can account for. In the case of an accelerometer, this is measured in G forces. Typically, they are powers of 2 (±2G, ±4G, ±8G, etc.). Gyroscopes are classified by the rate of angular rotation they can quantify. These are noted in the number of degrees/second (often in thousands). Magnetometers measure their capabilities in µT, which can vary depending on the axis of the sensor (x,y,z).
Sensitivity: An absolute number representing the smallest amount of change that can be measured and detected. For sensors, this is directly related to the number of bits reserved for the sensor in question. The more bits, the higher the sensitivity.
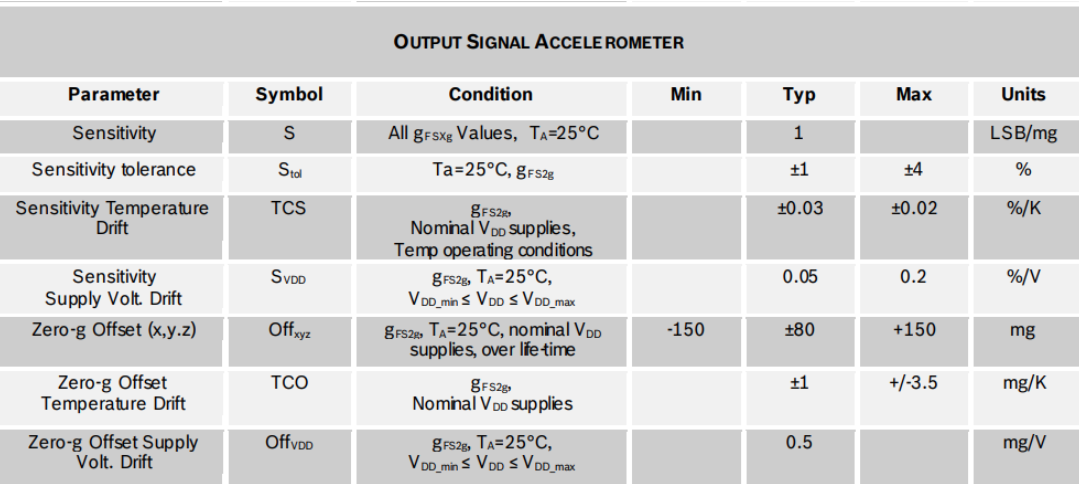
Zero G[ravity] Offset: This is the reading on the accelerometer when there is no external force being applied. This value effectively determines the minimum error that your accelerometer will detect.
Example of ZRO from BMF055 sensor (datasheet here)
Zero Rate Offset: Similar to the accelerometer Zero G Offset, the Zero Rate offset is the offset in value of the gyroscope when there is no angular motion present. The size of this offset is also affected by change in temperature. As such, this is often defined in degrees per second (/deg when referring to value temp).
Data Rates: The number of measurements taken over a specific period of time. Some combined sensors have independent data rates for their independent sensors. When picking out your IMU, make sure that the sensor rates supported fit your applications needs. This is different than the fused output sensor data rates.
Noise Density: Defined in units per square root bandwidth, typically ug/sqrt(Hz) for accelerometers and deg/s/sqrt(Hz) for gyroscopes; noise density gives rms (root mean square) acceleration noise value for accelerometers and rms rotation noise for gyroscopes (when multiplied by the square root of the measurement bandwidth at nominal Vdd and temperature).
Bandwidths: The range of frequencies that an accelerometer or gyroscope operates within.
Interfaces: You will need to consider how to communicate with the IMU and your embedded system. This link explains multiple interfaces in good detail.
Temperature Range: Identifies the minimum and maximum ambient temperature that sensors can safely operate within to provide accurate measurements.
Supply Voltage: The power that is supplied to an IC (integrated circuit) or sensor; absolute maximum rated supply voltage refers to the highest amount of voltage accepted before damage can be caused; operating supply voltage refers to the level of input power that is ideal for regular sensor operation.
Output Vectors
Once you’ve decided on which sensors you want to use and the conditions for them, you can start logging data with them. By using sensor fusion, you can help increase the value of your data by creating information that is greater than the sum of its parts. This section describes some fused outputs you may be interested in to save man-hours of development.
Rotation Vector: 9 axis fused output combining data from the accelerometer, magnetometer, and gyroscope. Each sensor supports the other to create a smooth output, and can output absolute heading. A main disadvantage is that it is susceptible to changes in the magnetic field to a degree.
Game Rotation Vector: 6-axis fused output combining data from the accelerometer and gyroscope. The game rotation vector removes magnetic field interference, but without a mag to correct the gyroscope, will slowly drift over time.
Geomagnetic Rotation Vector: 6-axis fused output combining data from the accelerometer and magnetometer. The geomagnetic rotation vector produces an output that doesn’t require the use of the most power-hungry component (the gyroscope), but does not produce as strong orientation information.

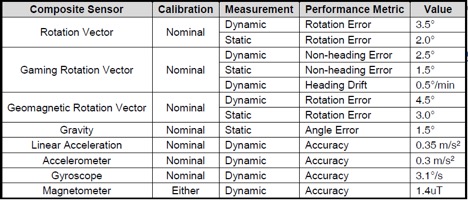
These output sensor characteristics are adapted from our BNO085 Datasheet
Dynamic Accuracy: This is the accuracy of the sensor fusion output while the device is in motion.
Static Accuracy: Accuracy of the sensor fusion output while the device is relatively stable/motionless.
Rotation Error: Difference between outputted vector and truth vector, measured in degrees.
Heading Error: Difference between outputted yaw and truth yaw, measured in degrees.
Heading Drift: Accumulated error of heading output as a function of time. This is a compounded error over heading error.
Non-heading Error: Difference between outputted tilt (pitch and roll) and truth tilt, measured in degrees.
RAW Accel/Gyro/Mag: The raw output of each sensor before any processing. This is effectively direct from each sensor.
Calibrated Accel/Gyro/Mag: Output of each sensor after sensor fusion has been used to process and clean up each signal.
Power Consumption
To figure out power requirements for your end product, you need to consider what mode your device will be operating under and for how long.
Power: Often measured in mW or mAh, this describes the consumption of energy by the device. When looking at these numbers, it is important to consider that not all sensors consume power at the same rates. Layer onto that the power requirements for the sensor fusion relative to that of each individual sensor, and this one characteristic becomes vitally important in the success of your product. Also ask such questions as: How fast can it wake up from low-power mode? Can you make some functions work with consistent low-power mode?
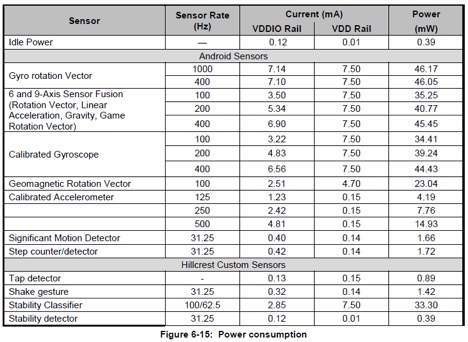
As an example (from our BNO08X datasheet) to show you about power consumption, we measured VDDIO (at 3V) and VDD (at 3.3V) to determine the power consumption difference between what the sensor fusion requires and what the raw sensor itself consumes, respectively. The VDDIO Rail is associated with the sensor fusion, and the VDD Rail relates to the minimum power required for the sensor. Looking over the VDDIO Rail values, it can be observed that the current used is proportional to the sensor rate. However, the value on VDD Rail is the same for almost all fused sensors at varied rates.
Taking the VDDIO value and multiplying it by 3V and summing it with the VDD Rail multiplied by 3.3V gives you the total power in the far right column.
Activity Classifiers
Activity classifiers are “soft sensors” (i.e., software-based sensors) that can be useful in saving your end application. Finding sensor fusion that provides these for you delivers added functionality that saves man-hours of effort. There are different classifiers provided by various sensor manufacturers, so be sure to do the proper research on which ones you can use. Below is a list containing a subset of activity classifiers that you may want to consider.
Small Gestures
Tap detector: Measures single and double taps on a device.
Shake detector: Uses an accelerometer to detect shaking of a device, including when the shaking ceases; this data is a valuable input to trigger a response.
Flip detector: Used to recognize if a device has switched positions, from facing up or down.
Pickup detector: Used to recognize if a device has been picked up.
Tilt detector: Sends a report any time it notices a change in a device’s tilt.
Pocket detector: Recognizes when a device enters or exits a pocket.
Physical Movement
Step detector and Step counter: Measures every time a step is taken
Significant motion: Triggers a response every time a large enough motion occurs
Stability classifier: Distinguishes between different types of stability: resting on a table, in hand, or moving in any direction.
Stability detector: Sends an output each time a device’s activity enters or exits a stable state.
Personal Activity Classifier: Identifies which action an individual is exhibiting out of a list of activities (i.e., differentiating between being still, walking, running, biking, or in vehicle)
Sleep detector: Tracks various states of sleep
Calibration
After you’ve looked through sensor requirements, fusion output options, power and activity classifiers, there’s one other thing you can consider: calibration. Which calibration options you choose depend on your budget and project needs.
Nominal: Nominal calibration uses statistically average values for the sensor of your choice to give it an average performance. The obvious benefit is reduced cost as there is no calibration requirement, but there is a trade-off of reduced individual performance.
Per-device: Per-device calibration calibrates certain factors like sensor gain on a sensor-by-sensor basis. By calibrating immutable factors of the device, there are benefits to the overall performance of each sensor. Depending on your particular application, you could choose to calibrate based on a single axis or multiple axes if your application is largely within certain limitations. For instance, our FSM300 sensors are all planar calibrated about the gravity axis (for applications along a single axis), while our FSM305 sensor is 3D calibrated (for multi-axis applications).
Dynamic: If you find the nominal calibration is acceptable, your sensor output can still be improved dynamically while in-field. Sensor characteristics like ZRO and ZGO changes over temperature can be adjusted as the sensor is used in its final application.
This list gives you a lot to digest. Understanding sensor terminology and the overall concepts of what differentiates sensors is the first step in deciding how to get the most out of your technology. If you need a deep dive into the IMU itself, check out our post “What is an IMU Sensor.” And click here for a look at “Universal Technical Challenges in IMUs.”


