5 min read
Introduction
In my previous post, I described the complexity programmers face embedding their software into a chip, and challenges they will face when they are get to debug. I talked about various areas where programmers might face difficulties while porting their software to this complex environment, typically a mix of many hand-crafted software and hardware components. In this post I will dig a little deeper into the CEVA Software Development Tools and the capabilities they provide to help manage the challenges of DSP programming and debugging.
CEVA Software Development Tools
CEVA Software Development Tools, together known as SDT, includes all the tools that a software engineer needs to easily and effectively program CEVA DSP platforms: to compile, link, debug and profile DSP applications, on the Software Simulation platform or on the hardware. They also provide you with a reliable, clear and convenient way to observe and control the internal state of the software and hardware on the hardware target. Figure 1 below shows the relationship between SDT and the various tools I will discuss next.
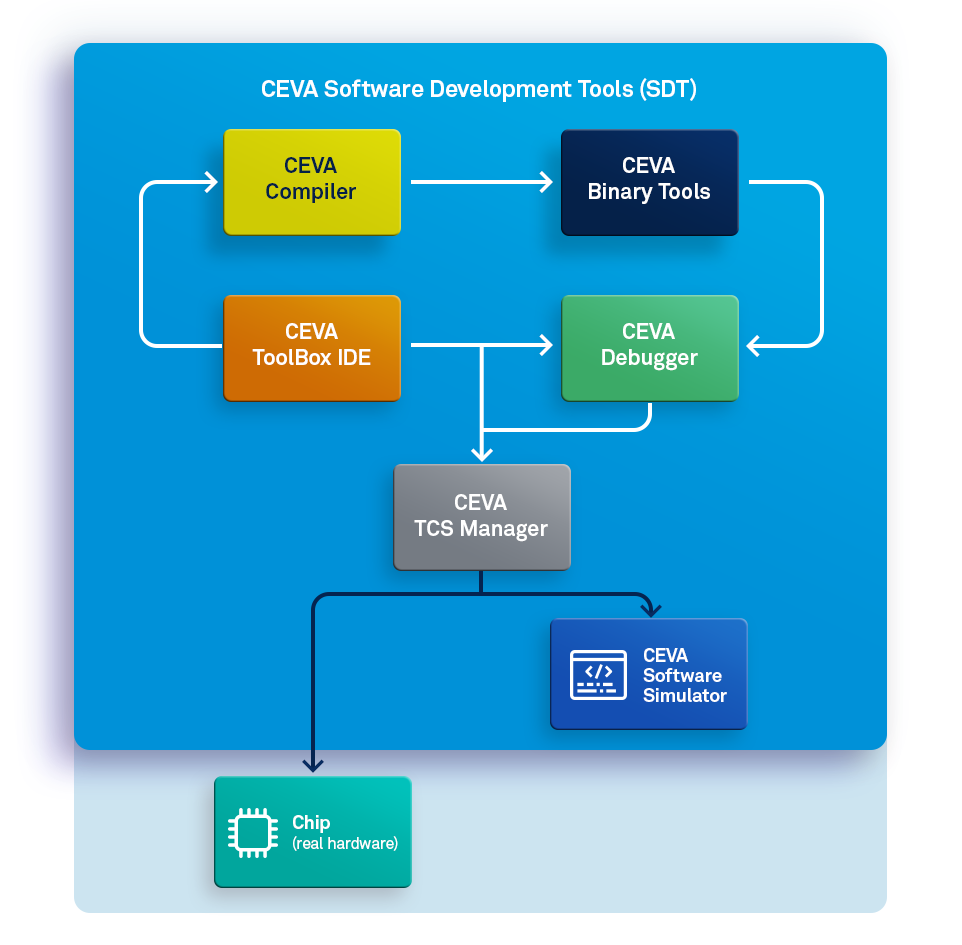
Figure 1: Block diagram of SDT basic components. The SDT IDE can trigger a build process via the Compiler and binary tools, generating a DSP application. It also provides debugging either of an actual chip or through a software simulation of the DSP.
Compiler
Since CEVA DSPs have differentiated hardware capabilities, the assembly language used to program these processors is necessarily unique to CEVA. CEVA’s C/C++ compiler will generate optimized assembly operations from user source code, producing compact and fast assembly code. In many cases, the execution time of compiled code is comparable to that of hand-optimized assembly code; however it is also possible for you to add your own assembly code where you may feel the need for hand-tuned code in your application.
Linker
The CEVA Linker gathers all binary object files generated by C/C++ compiler and assembler and combines them, linking with static libraries (provided by CEVA or other parties), resolves all address references and generates an application, which is ready to be executed on the CEVA DSP target. The target can be either a software simulation or the actual hardware. Execution can be controlled using the CEVA Debugger or run in a headless mode (for example, when booting from on-board flash memory). A unique feature of the CEVA Linker is its ability to perform global program optimization, minimizing the amount of memory used by symbol references in the code memory.
Debugger & Profiler
Available as an Eclipse IDE plugin or as a standard SystemC API, the CEVA Debugger allows you to execute an application on the CEVA DSP Simulator or on an actual hardware target. In addition to providing debug capabilities, the Debugger gathers information during execution for profiling feedback to find performance bottlenecks, in execution time or memory usage. This profiling information is displayed in a graphical manner for easy review.
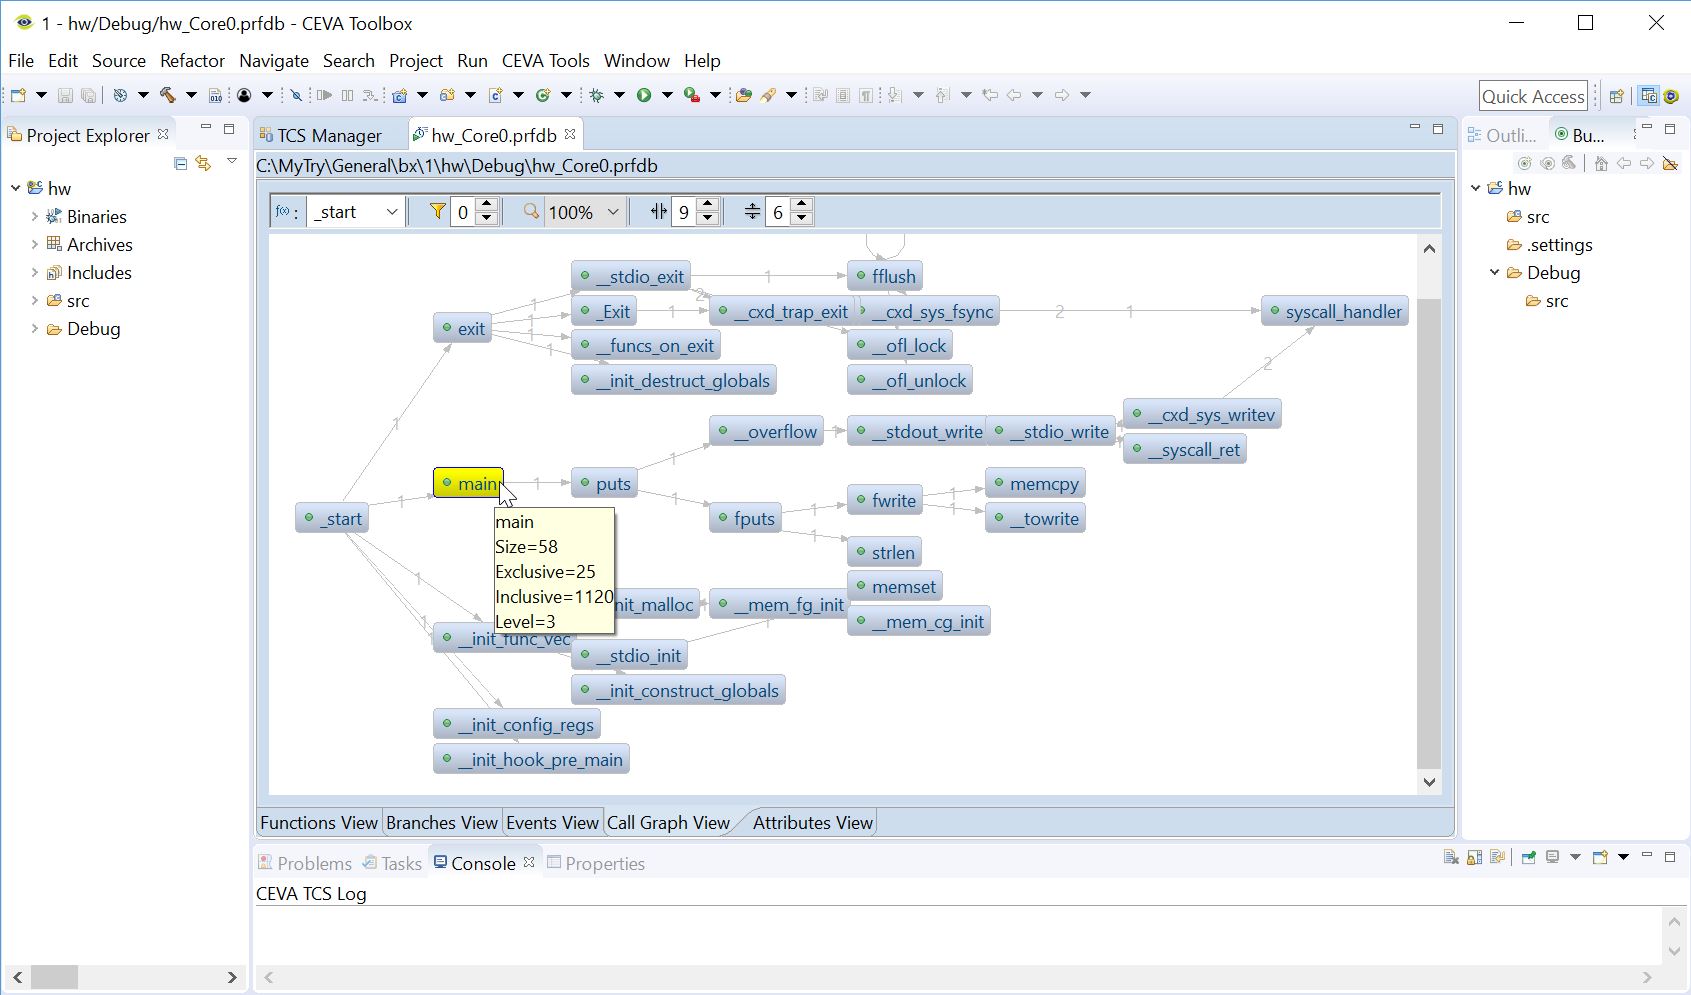
Figure 2: CEVA SDT ToolBox IDE Profiling results Call Graph View: visualization of the program flow.
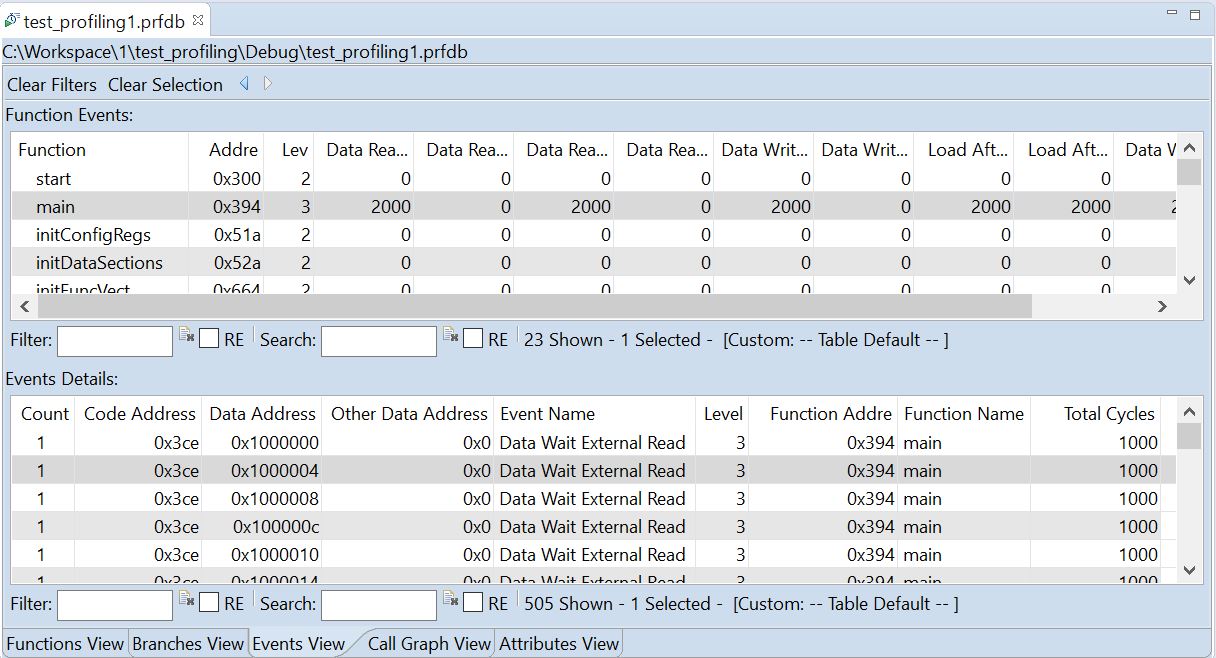
Figure 3: CEVA SDT ToolBox IDE Profiling results Memory Events View: details of the memory events which result with cycles latency.
Debugger automation can be supported either by the Eclipse ISE built-in scripting support (EASE), or by integrating the Debugger into a SystemC environment. Both simplify test automation for executing multiple possible scenarios and reaching high coverage rate for software, as needed by safety-critical applications for example. The Debugger can be configured to a target using CEVA’s Target Connectivity Server (TCS) Manager. This encapsulates CEVA experience with possible hardware debugging connection issues and faults and simplifies access to the target selection, connection configuration and status check through a graphical user interface.
CEVA Hardware Debugging Configuration Interface
Requirement
As experienced programmers know, debugging on hardware can be painful. The CEVA Target Connectivity Server (TCS), was designed to help you easily configure the debugging target and the preferred communication mechanism. In addition, the configuration interface provides immediate indication of basic status of connection to hardware or hardware version mismatch issues, as well as an easy way to restrict allowed memory accesses, in order to avoid infinite waits caused by accesses to non-existing memory.
Driver Configuration
Setting a target connectivity server driver allows you to choose the component which will provide the actual hardware connection. The machine on which the Debugger executes connects to the driver via network connection, and the driver communicates with the selected hardware using the JTAG protocol. Figure 4 below shows the process of selecting a driver through the TCS interface.
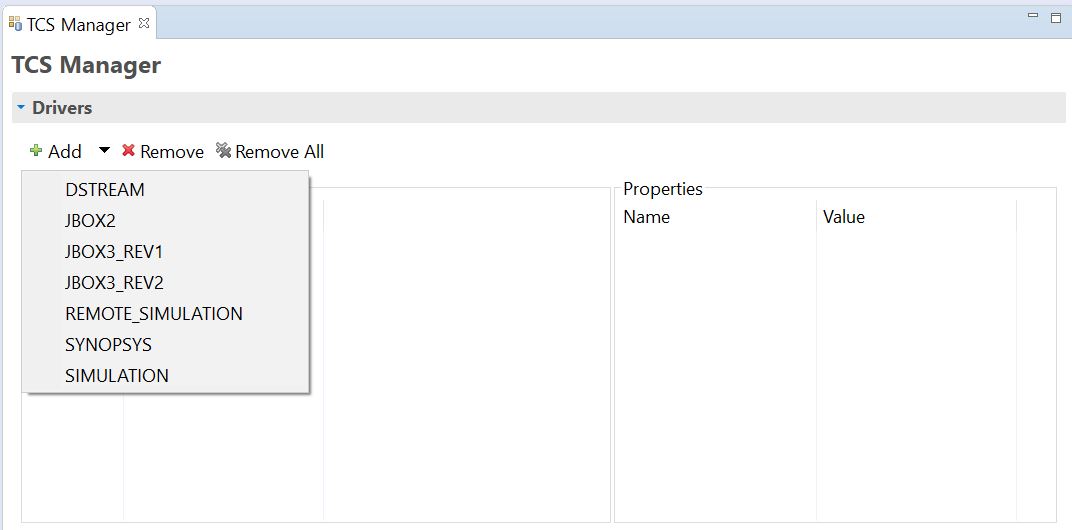
Figure 4: TCS driver selection menu
Once a driver is selected, you can also choose configuration options – directly from the same interface (Figure 5).
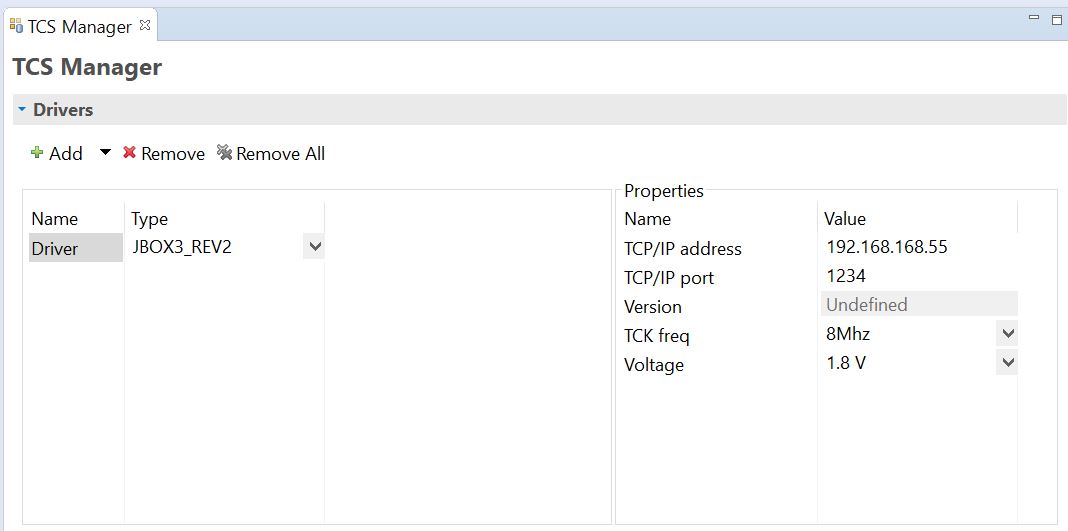
Figure 5: TCS driver configuration options
System Setup
Over on the hardware side, you can control which components of the system you want to debug. TCS provides a mechanism to set a specific configuration for each component in the hardware system structure (Figure 6).
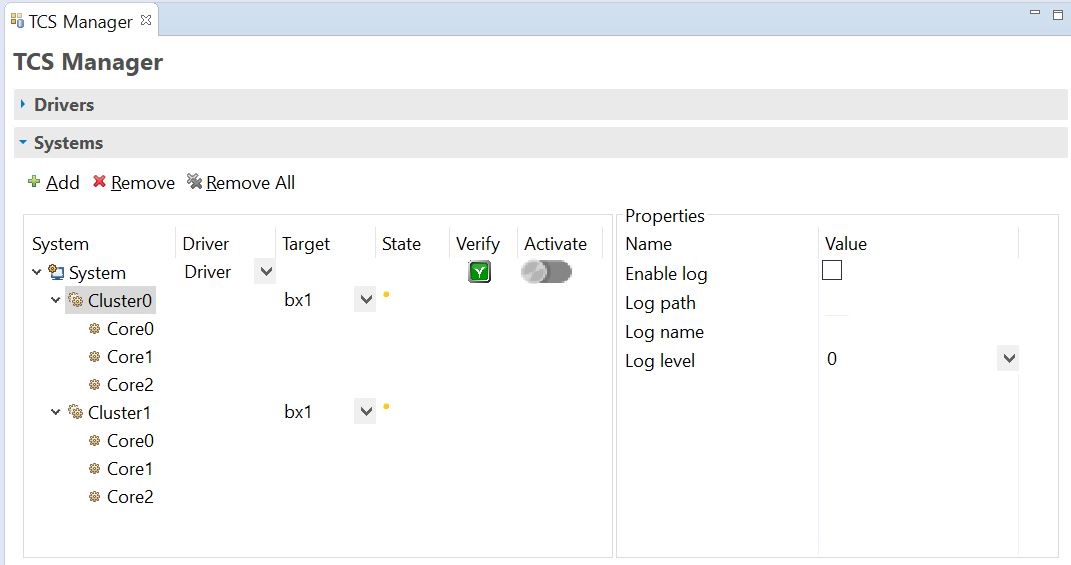
Figure 6: TCS system description user interface
A very important capability in TCS allows you to immediately check system connectivity, by pressing the ‘verify’ button. This triggers a list of sanity checkers which run basic tests to make sure that all elements are ready for a successful connection and a valid debug session. This ensures that the driver is actually connected and activated, that it executes a supported firmware version, that the targeted hardware is connected and powered on, that its expectation of the CEVA processor version corresponds with the actual hardware, and more tests of this type. Running these sanity tests can help avoid a huge amount of wasted time in bringup and debug.

Figure 7: TCS: verify button execution result
There are other capabilities you can configure through TCS. For example, complex issues don’t always manifest themselves in clear hardware bug symptoms. To help isolate these, there is a built-in log mechanism embedded in the TCS user interface – per cluster – which allows you to capture the full communication between the Debugger and the driver. This in many cases can quickly lead you to the root cause of a fault.
Another very useful configuration option is the ability to define dedicated memory barriers, per defined clusters of cores. Often, such a cluster of cores mapped to a limited range of physical memory. In this case, there are memory ranges which might be invalid for this cluster and accessing an out-of-range memory location may lead to an endless wait. Triggering an access to those non-valid memory cells is not always intentional; simply scrolling a memory view window could lead to such an error. Memory barriers help prevent these problems so that invalid memory ranges access requests will be simply ignored by the Debugger which will not send them to the driver.
Finally, the CEVA debugger provides many of the debugger features you know and love from your PC-based debuggers but has been crafted to be intimately connected to the CEVA-based hardware.
Summary
In this posts series we reviewed chip programming and debugging challenges, and listed CEVA’s way to make programmers life easier by enabling effective and well-protected connection to the hardware platform. CEVA continuously strives works on enhancing your development experience, encapsulate our users and our own practices and struggles while developing real life products.
- Read More:
-
- The Banality of Bringup Evil, Ariel Hershkovitz, Embedded.com
-

